Lessons Learned from the Bank Failure Epidemic in the Sixth District: 2008–2013
by Michael Johnson, Senior Vice President, Federal Reserve Bank of Atlanta
The period during and following the December 2007 to June 2009 Great Recession was an exceptionally challenging operating environment for U.S. banks. Between 2008 and 2013, more than 480 insured financial institutions failed nationally. Conditions in the Southeast, however, were particularly acute: More than one-third of the nation's failures occurred in the Sixth District. This equates to a regional failure rate of 15.1 percent, the highest of any Federal Reserve District.1
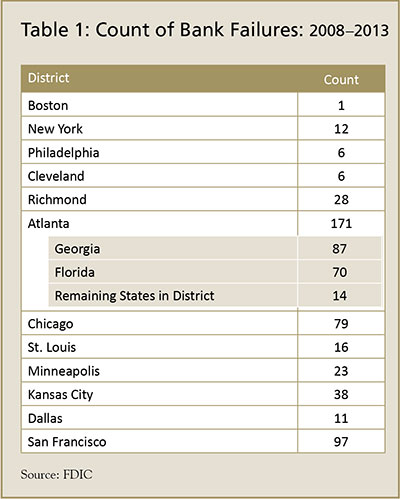
The number of bank failures in the Sixth District varied widely by state. Eighty-seven banks failed in Georgia, and 70 banks failed in Florida (Table 1). In contrast, the remaining states that make up the Sixth District (Alabama and portions of Louisiana, Mississippi, and Tennessee) reported only 14 total failures between them. This article discusses the factors that contributed to the high concentration of bank failures in Georgia and Florida and some of the lessons learned from this rash of failures.2
"The Usual Suspects": Contributing Factors to Bank Failures
The federal banking agencies have conducted several postmortem studies on the banking crisis, including material loss reviews of failed banks3 and aggregate analyses prepared by the Federal Reserve Board's Office of Inspector General (OIG)4 and the U.S. Government Accountability Office. 5 All these studies identified a common set of factors that contributed to bank failures in recent years, including:
- rapid loan portfolio growth;
- high concentrations in commercial real estate (CRE), specifically construction and development (C&D) lending;
- heavy reliance on noncore funding, particularly brokered deposits;
- insufficient capital to cover losses;
- a large number of newer, untested de novo banks; and
- inadequate internal risk management policies.
These factors, in many respects, were more prevalent and more pronounced in Georgia and Florida; when timed with a rapid and acute economic contraction and deterioration in many local housing and construction markets, the resulting "perfect storm" created a deeper and longer-lasting impact than elsewhere in the nation.
Rapid Portfolio Growth and High Concentrations in CRE
Bank growth that greatly exceeds the local market economic growth rate, especially over a prolonged period, is often a red flag. Between 2005 and 2007, the Sixth District averaged comparatively robust double-digit total loan growth, nearing 15 percent in Georgia and 20 percent in Florida. This stands in contrast to the more modest loan growth of 7.7 percent for banks outside of the District. The growth in U.S. gross domestic product over this period was 5.7 percent.6 In comparison, Florida's and Georgia's gross domestic product growth averaged 6.8 percent and 5.1 percent, respectively, during the same period. The loan growth in Georgia and Florida was heavily concentrated in real estate. CRE and C&D loan concentrations and growth in both states greatly exceeded national medians (Figures 1-3). As a result, the natural contraction in CRE lending was more severe when the market deteriorated, significantly affecting the local economy, more so than in many other areas. Exposures have since declined but still remain well above the rest of the nation.

High CRE and C&D exposures were closely correlated with the incidence of bank failure. Indeed, between 2008 and 2013, more than half of the banks that failed reported that their highest ratio of delinquencies to total loans outstanding was in the C&D loan portfolio (Table 2 and Figure 4). Residential mortgages ranked second, followed by commercial mortgages (nonfarm nonresidential plus multifamily).
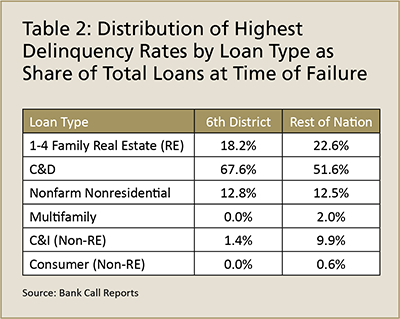
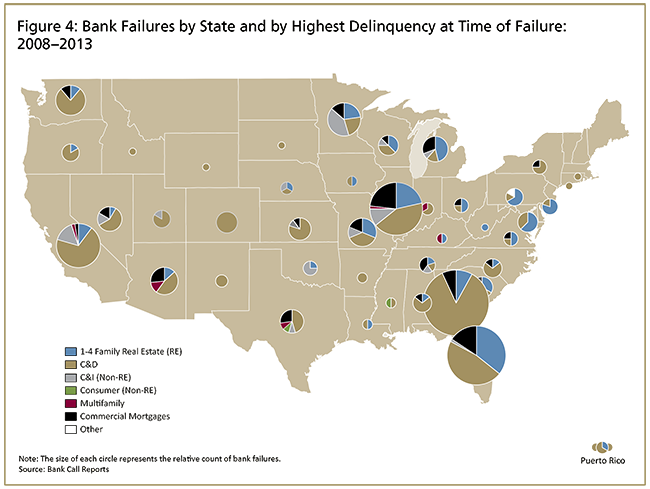
The prevalence of C&D loan delinquencies was even higher in the Sixth District when compared with the rest of the nation. More than three-quarters of the banks that failed in Georgia reported that their C&D loan portfolio had the highest delinquency rate of all loans at the time of failure.
Commercial and residential land values in some Sixth District markets (such as Atlanta, Orlando, South Florida, and Tampa) fell by at least 60 percent peak to trough.7 Single-family permit issuance in Sixth District states fell by more than 80 percent, while the value of nonresidential construction put in place declined by nearly 60 percent.8 In essence, it appears that rapid, outsized loan growth heavily concentrated in C&D lending led to high delinquencies in these risky categories when the market collapsed, which then contributed to a vicious negative reinforcing cycle.
Heavy Reliance on Noncore Funding
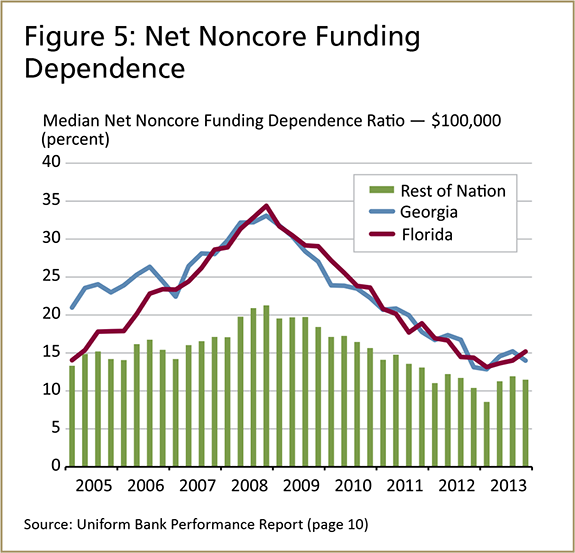
Beginning in 2005, total loan growth eclipsed deposit growth at the national level as well as in the Sixth District, causing banks to turn to other funding sources to sustain this robust pace.9 However, as noted in the Federal Reserve OIG report on failed banks, "[r]eliance on non-core funding sources is a risky strategy because these funds may not be available in times of financial stress and can lead to liquidity shortfalls."10 By 2008, the median net noncore funding dependence ratio in Georgia and Florida far exceeded the rest of the nation (Figure 5). In a majority of Georgia and Florida bank failures, reliance on certain specific funding sources (for example, brokered deposits) was cited as a contributing factor in subsequent material loss reviews. Once again, growth beyond the economic capacity of the local market, in this instance with core deposits serving as a market proxy, can exacerbate an already problematic banking environment.
Insufficient Capital
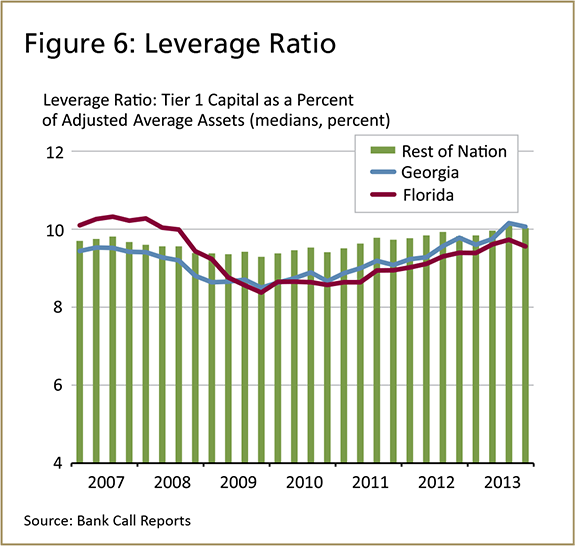
Capital is a key indicator of a bank's health; ultimately, a bank fails when its capital is exhausted. Rapidly deteriorating asset quality, increases in the provision for loan losses, rising charge-offs, and declining earnings can quickly deplete bank capital unless additional capital injections can be secured. Rising losses at Florida banks pushed the median leverage ratio below that of the rest of the nation for several quarters beginning in 2009, and Georgia's ratio has, until just recently, trailed that of the nation (Figure 6). It is critically important for banks to engage in ongoing capital planning, which includes the ability to project the effects of market changes on the value of the portfolio.11 Our anecdotal experience suggests that those banks that raised material amounts of capital at the beginning of the recession had a much greater chance of surviving relative to peers that took a wait-and-see approach to raising capital. In addition, troubled banks that had little or no perceived franchise value by investors, such as banks with low levels of core deposits or very limited retail deposit-gathering networks, found it very challenging to attract additional capital.
De Novo Banking
The Sixth District accounted for nearly 30 percent of new banking activity between 2000 and 2007.12 California ranked first, Florida ranked second, and Georgia third in terms of new institution charters. Nationwide, the failure rate for these newer institutions was 14 percent, which contrasts with Georgia's much higher failure rate of 42 percent and Florida's 19 percent. These higher percentages are partially attributable to excessive C&D and CRE lending at Georgia and Florida banks. Some of these de novo bank failures can clearly be attributed to poor timing, but it is important to note that not all de novo banks failed. Those that did fail generally had more aggressive growth strategies, consistent with the characteristics previously discussed.
Inadequate Risk Management Policies
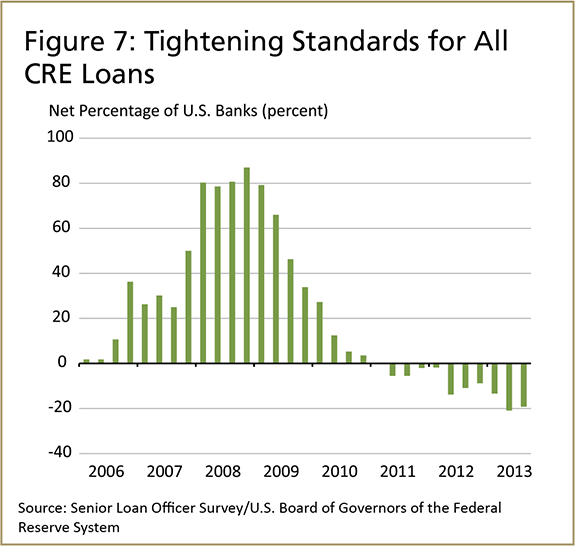
During the Great Recession, Georgia and Florida banks found themselves particularly vulnerable to a confluence of events that placed them at high risk for failure: rapid loan growth, excessive CRE and/or C&D exposures, deteriorating local economic or real estate conditions, overreliance on noncore funding, and lower levels of capital. However, these factors did not necessarily indicate that a bank was destined to fail. Indeed, most banks in the Sixth District did not fail during the recession despite facing many of the same headwinds as those that did. The majority of material loss reviews and the "Summary Analysis of Failed Bank Reviews" indicated that failure was, in part, attributable to a lack of sound risk management policies, including delayed action by management. For example, the Federal Reserve Board's quarterly Senior Loan Officer Opinion Survey on Bank Lending Practices13 showed that banks, on net, were slow to tighten underwriting standards nationally on total CRE loans (C&D and nonfarm nonresidential, and multifamily mortgages) (Figure 7). In other words, it may have been a case of banks attempting to maintain "good" financial performance by continuing to add volume and taking on added risk in the hopes of riding out the recession.
Lessons Learned
It is clear that several factors contributed to bank failures in the Sixth District, and the discussion above dissected the particular issues that made experiences in Georgia and Florida so painful. What can community bankers take away from this review? The key to avoiding a similar fate in the next downturn will be for community bankers to take to heart the lessons identified in postmortem studies, particularly the importance of a sound, sustainable strategy and risk management practices. Sound strategy and effective risk management appear to have been key differentiating factors because not all banks with similar characteristics failed. Many of those that did fail continued to grow and lend in high-risk areas, funding that growth with noncore deposits, and were slow to raise much-needed capital or respond to the risks around them. While future crises will likely present a unique set of challenges, it is safe to say that those that will struggle are likely to repeat these themes, while those that survive will have learned these important lessons.
Back to top
- 1 This rate is calculated as a percentage of total banks at year-end 2007.
- 2 This analysis is based primarily on commercial bank (as opposed to thrift) data drawn from bank Call Reports and the Uniform Bank Performance Report.
-
3
Section 38(k) of the Federal Deposit Insurance Act requires that the inspector general of the appropriate federal banking agency complete a review of the
agency’s supervision of a failed institution and issue a report within six months of notification from the Office of Inspector General of the Federal
Deposit Insurance Corporation (FDIC) that the projected loss to the Deposit Insurance Fund is material. Material loss reviews conducted by each of the
agencies can be found at oig.federalreserve.gov
 (Federal Reserve), fdicoig.gov/MLR.shtml
  (FDIC), and http://ow.ly/FyyEF
  (Office of the Comptroller of the Currency).
-
4
See Board of Governors of the Federal Reserve System Office of Inspector General, “Summary Analysis of Failed Bank Reviews,” September 2011, available at http://ow.ly/EChJN.

-
5
See Government Accountability Office, “Causes and Consequences of Recent Bank Failures,” January 2013, available at www.gao.gov/assets/660/651154.pdf.

- 6 Data are based on the average of quarterly year-ago percent change in nominal gross domestic product and were obtained from the Bureau of Economic Analysis.
-
7
Joseph B. Nichols, Stephen D. Oliner, and Michael R. Mulhall, “Swings in Commercial and Residential Land Prices in the United States,” American Enterprise
Institute Economic Policy Working Paper 2012–03, June 2012, available at http://ow.ly/ECioo.

- 8 This information is based on U.S. Census Bureau data and Moody’s Analytics estimates.
-
9
This information is based on the Board of Governors of the Federal Reserve System Statistical Release H.8, “Assets and Liabilities of Commercial Banks in
the United States,” available at www.federalreserve.gov/releases/h8/default.htm
 , as
well as on Call Report data for Sixth District banks.
- 10 See “Summary Analysis of Failed Bank Reviews.”
- 11 For a discussion of the role of capital planning at community banks, see Jennifer Burns, “View from the District: Capital Planning: Not Just for Troubled Times,” Community Banking Connections, Third Quarter 2013, available at www.cbcfrs.org/articles/2013/Q3/Capital-Planning-Not-Just-for-Troubled-Times.
- 12 New banking activity is defined as institutions that are truly de novo, which excludes new specialty lenders and those that were sponsored by either a holding company that existed at least six months prior to the filing date of the new charter or a holding company that had at least one preexisting subsidiary. (This information was obtained from SNL Financial).
-
13
See the Federal Reserve Board’s website at www.federalreserve.gov/BoardDocs/snloansurvey/.

