What Explains Low Net Interest Income at Community Banks?
by Charles S. Morris, Vice President and Economist, Federal Reserve Bank of Kansas City
and Kristen Regehr, Assistant Economist, Federal Reserve Bank of Kansas City
Community bank profitability declined sharply during the 2007–09 financial crisis and recession. Profitability has improved since the crisis, primarily due to declines in loan-loss provisions. Net interest income — the largest source of revenue for community banks — has remained flat, however, and is below precrisis levels. According to many observers, including community bankers, the low interest rate environment has made it difficult for financial institutions to earn an adequate spread on loans since the recession ended. In addition, bankers say weak lending opportunities and loan demand have contributed to reduced interest income.
This article summarizes the findings of a recent study that discusses the factors that most influence community bank net interest income and the extent to which these factors are contributing to the current low levels of net interest income.1 Additionally, the article examines whether net interest income (since the crisis and recession began) is abnormal relative to historical experience. The results of the study suggest the lack of recovery in community bank net interest income seven years after the start of the financial crisis and recession is not unusual given economic and banking conditions.
Historical Background
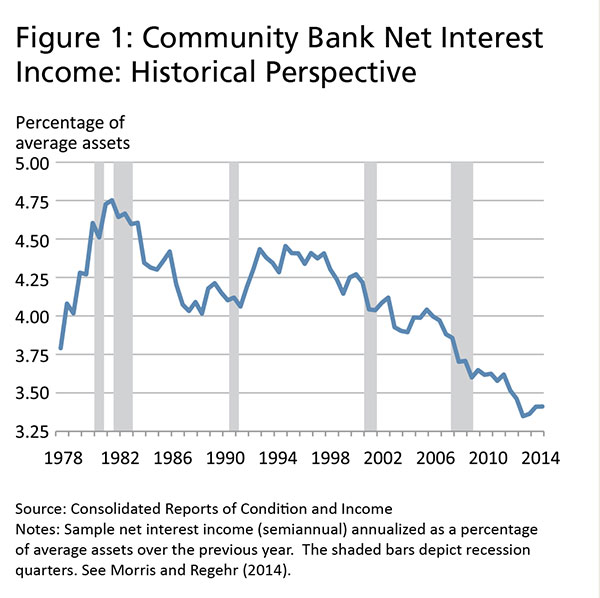
Community bank2 net interest income has varied significantly over the past 38 years. In order to compare how net interest income performed during the most recent recovery relative to previous recoveries, we conducted an analysis of net interest income starting in 1977. The 1973–75 and 1981–82 recessions, along with the 2007–09 recession, were the three longest recessions since the Great Depression. Figure 1 shows the average net interest income over the study period. During the study period, average net interest income for community banks varied from a high of 4.75 percent of average assets in the first half of 1981 to a low of 3.35 percent in the first half of 2013. Net interest income for the second half of 2014 was 3.41 percent.3
What Banking and Economic Factors Affect Net Interest Income?
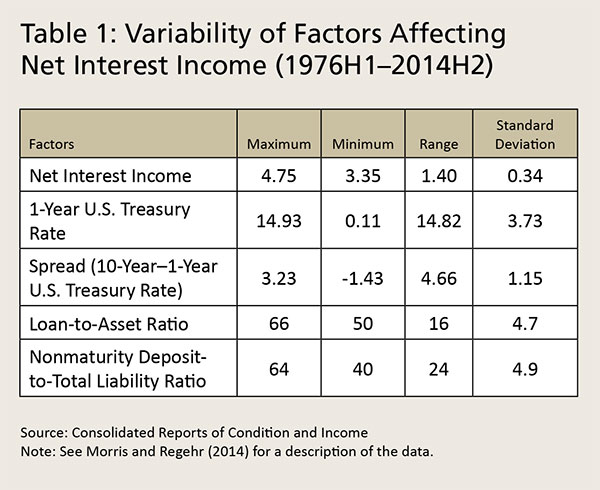
Given the variability of net interest income, it is not surprising that the banking and economic factors expected to most affect net interest income also varied significantly over this period. From 1977 to 2014, there were large variations, as measured by standard deviations, in the 1-year U.S. Treasury bill rate, the average loan-to-asset ratio, and the average nonmaturity deposit-to-liability ratio (Table 1). Understanding how these factors should affect net interest income is important for understanding if the results from a model that estimates their effects make sense.
Changes in market interest rates — both the absolute and relative levels — have perhaps the most significant effect on net interest income in the short term. When interest rates change, the degree to which net interest income changes depends on a bank’s asset and liability maturity structure and the extent to which a bank’s loan and deposit rates reset when market rates change prior to maturity. A bank is said to be asset sensitive if its assets have a shorter maturity or reprice faster than liabilities and is liability sensitive when the converse is true.4 These relative sensitivities imply that a parallel increase in the yield curve increases net interest income for asset-sensitive banks and decreases net interest income for liability-sensitive banks. These relationships are shown in the first (1) column of Table 2.
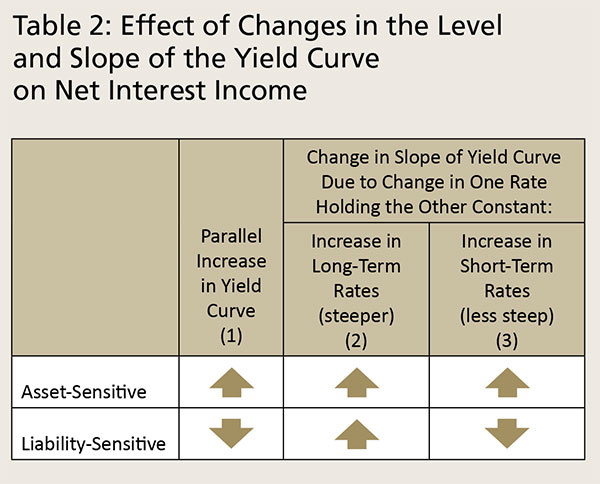
The effects of changes in the slope of the yield curve on net interest income not only depend on whether a bank is asset or liability sensitive but also on whether the change in the slope is due to a change in long-term or short-term interest rates, as shown in the second (2) and third (3) columns of Table 2. If long-term rates increase so that the yield curve is steeper, net interest income will increase regardless of whether banks are asset or liability sensitive. This is because higher long-term rates affect only new and maturing long-term loans and investments, both of which will earn higher returns and can be funded with short-term liabilities at unchanged rates.
However, when short-term rates increase, which decreases the slope of the yield curve, the effect on net interest income depends on whether the bank is asset or liability sensitive. For an asset-sensitive bank, a rise in short-term rates will cause net interest income to increase because the interest income from new short-term assets and current assets that reprice off short-term rates will rise more than the interest expense on short-term deposits. In contrast, for a liability-sensitive bank, an increase in short-term rates will decrease net interest income because the interest expense on short-term deposits will rise more than the interest income on new short-term and current repricing assets.
Net interest income is also affected by the composition of assets and liabilities. Among a bank’s assets, loans generally have a higher interest rate than marketable securities do because loans tend to be riskier. Among liabilities, nonmaturity deposits tend to have the lowest interest expense, partly because a large share of nonmaturity deposits generally pay lower interest rates than comparable deposits that do not provide transactions services. As a result, net interest income should increase as the loan-to-asset or nonmaturity deposit-to-liability ratios increase.
What Does Regression Analysis Tell Us About Why Net Interest Income Is So Low?
To determine why net interest income has not recovered in the six years since the end of the financial crisis and recession, a “base” regression model is constructed to estimate the influence of various economic and banking variables on net interest income. Variables used in the model include market interest rates (1- and 10-year U.S. Treasury rates), bank balance sheet items (loan-to-asset and nonmaturity deposit-to-liability ratios and inflation-adjusted total assets), and macroeconomic conditions (real GDP growth and inflation).
The base model also includes variables that capture “interactive” effects between the interest rate and balance sheet variables.5 The effect of changes in interest rates on net interest income may depend on the size of balance sheet items. For example, if the loan-to-asset ratio is relatively high, an increase in interest rates may cause interest income to rise more than if the loan-to-asset ratio is low, because loan rates are typically higher than the returns on other assets. The base model assumes the relationship between each variable and net interest income does not change over the entire sample period; that is, the recent recession and expansion are not fundamentally different from any other recession and expansion in the sample period.
Results from the base model are summarized in the first (1) column of Table 3. The top half of the table shows the estimated immediate effects of a 100-basis-point increase in each variable on net interest income, holding constant all other factor values. Because a change in the variables generally takes time to fully affect net interest income, the table also shows the cumulative effects, which are shown in the bottom half of the table. Approximately 80 percent of the cumulative effects occur within two years of a change in the value of a factor, and about 90 percent within three and a half years.6
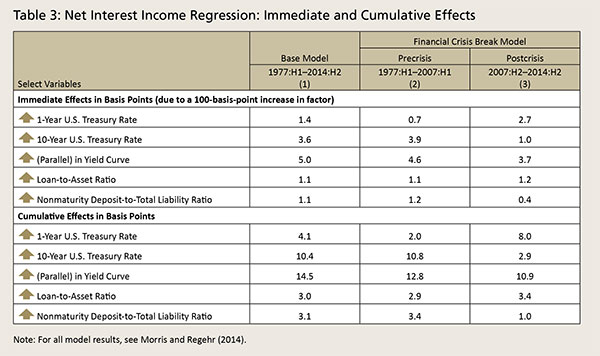
The main findings of the base model indicate that community banks are asset sensitive on average. A parallel increase in the yield curve and an increase in long- and short-term rates are estimated to increase net interest income, which is consistent with the asset-sensitivity effects in Table 2. For example, the estimated immediate effect of a 100-basis-point parallel increase in the yield curve is a 5-basis-point increase in net interest income. As expected, an increase in the loan-to-asset or nonmaturity deposit-to-liability ratios increases net interest income, which supports the importance of lending and the deposit mix for community bank net interest income.
The cumulative effects provide a good measure of the degree to which the effects of the variables on net interest income are economically meaningful. In general, we found the sizes of the cumulative effects to be economically meaningful.7 For example, the estimated cumulative effect of a 100-basis-point percentage-point parallel increase in the yield curve is a 14.5-basis-point increase in net interest income, with about 12 basis points of the increase occurring within 2 years. Thus, the base model results combined with low interest rates, fewer lending opportunities, and a relatively flat yield curve during all or some of the years since the start of the financial crisis and recession are consistent with the persistently low net interest income at community banks.
Has the Behavior of Net Interest Income Changed Since the Crisis?
To allow for the possibility that the decline in net interest income is out of the ordinary, a second model is estimated — the financial crisis break (FCB) model. The FCB model includes the same variables as the base model but allows for the possibility that their estimated effects on net interest income change after the start of the financial crisis in the second half of 2007.
The FCB model’s results are shown in the second (2) and third (3) columns of Table 3. The estimated effects are consistent with the banks being asset sensitive in both the pre- and postcrisis periods, and the balance sheet items have the expected positive signs in both periods.8 The sizes of the cumulative effects generally are economically meaningful in both periods.
The estimated immediate and cumulative effects appear to have changed somewhat in the postcrisis period.9 Some of the effects are smaller in the postcrisis period and others are larger. The largest changes in the cumulative effects are the 1-year Treasury rate (+6 basis points) and the 10-year Treasury rate (–7.9 basis points). Thus, based on these results, it is unclear whether the FCB model is better than the base model in explaining why community bank net interest income remains so low.
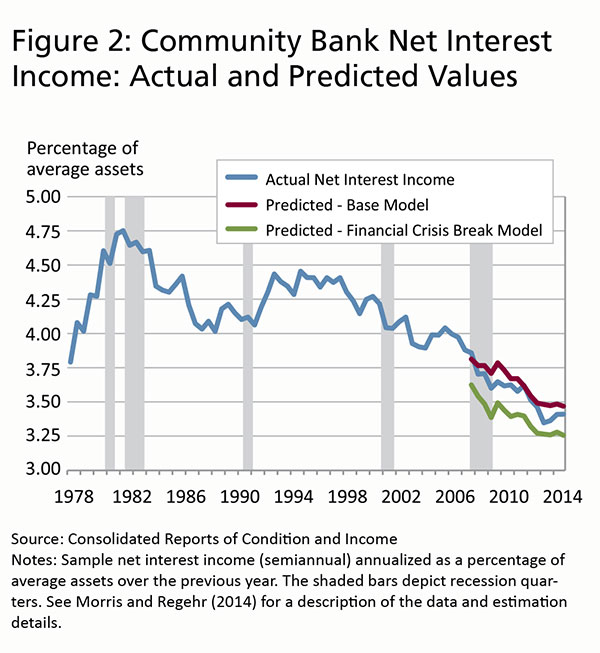
One way to determine if the relationship between community bank net interest income and the variables has changed is to see whether the base or FCB model is a better predictor of net interest income in the postcrisis period (Figure 2).10 The FCB model (green line) underpredicts community bank net interest income over the postcrisis period with a relatively constant gap and, overall, predicts a 62-basis-point decline from the first half of 2007 relative to an actual decline of 47 basis points. In other words, even though community bank net interest income is already near a 40-year low, the FCB model predicts it should be 15 basis points lower. Although the base model (dark red line) generally overpredicts net interest income, the predictions are more reasonable. The predicted value of net interest income in the second half of 2014 is just 6 basis points greater than the actual value, so the overall decline in net interest income over the prediction period is much closer to the actual decline than in the FCB model. A summary measure of predictive errors is the “root-mean-square error” (RMSE).11 The RMSE of the base model is 8 basis points, which is more than 50 percent better than the 18 basis points of the FCB model. Thus, the base model appears to forecast somewhat better than the FCB model, suggesting the behavior of net interest income in the current recovery may not be that unusual given historical experience.
How Would Net Interest Income Change If Key Variables Return to More Normal Levels?
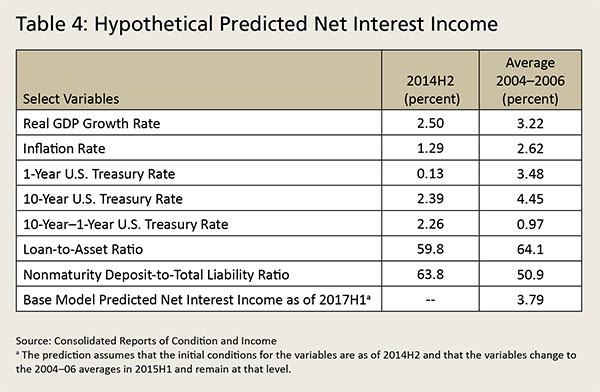
To get a sense of how a return to more normal levels of the key variables might affect net interest income, the base model is used to estimate what net interest income would be if these variables returned to their 2004–06 average levels in the first half of 2015 and remained at those levels over the following two years (Table 4). The two-year time frame is chosen because approximately 80 percent of the cumulative effect of changes in the variables on net interest income would be realized by the first half of 2017. The base model predicts that net interest income would be 3.79 percent in the first half of 2017 — a 38-basis-point improvement from the current 3.41 percent — although it would still be 19 basis points below the 2004–06 average.
Summary
This analysis shows that the lack of recovery in community bank net interest income in the seven years since the start of the financial crisis and recession is not unusual given economic and banking conditions. The regression results from the base model indicate that low interest rates, fewer lending opportunities, and a relatively flat yield curve during all or some of the years since the start of the financial crisis and recession have contributed to the current low levels of net interest income. These results also suggest, however, that low net interest income is not the new normal for community banks. Although net interest income may be unlikely to return to the high levels of the early 1990s, as the economy improves, net interest income is likely to rebound significantly.
Back to top
- 1 See Charles S. Morris and Kristen Regehr, “What Explains Low Net Interest Income at Community Banks?” Economic Review, Federal Reserve Bank of Kansas City, 2014 Second Quarter, at www.kansascityfed.org/~/media/files/publicat/econrev/econrevarchive/2014/2q14morris-regehr.pdf

 for a description of the data.
 - 2 While the Federal Reserve typically defines community banks as those with $10 billion or less in total assets, for the purpose of this analysis, community banks are defined as banks with total assets of $1 billion or less in 2012 dollars.
- 3 The data are semiannual instead of quarterly because the income portion of the Consolidated Reports of Condition and Income (commonly known as the Call Report) was filed only semiannually prior to 1983.
- 4 The repricing effects here include the total effects that account for factors such as floors on loan rates and the historical “stickiness” of deposit rates when interest rates rise.
- 5 The interactive effects in the base model are the interest rates multiplied by the levels of balance sheet items. The base model also includes two lags of net interest income, to account for the persistence in net interest income, and other variables to control for other factors that affect net interest income. For the complete base model specification and estimated results, see Morris and Regehr (2014).
- 6 Table 3 focuses on the primary variables of interest for this article. See Morris and Regehr (2014) for all the results. As noted in the text, the base model allows for the effect of interest rates on net interest income to depend on the levels of balance sheet items and vice versa. In Table 3, the immediate and cumulative effects of interest rates and balance sheet items include both the direct and interactive effects.
- 7 Formal statistical tests show that the estimated immediate effects of the variables are different from zero with a high degree of confidence.
- 8 Formal statistical tests show that the estimated immediate effects of the variables are different from zero with a high degree of confidence. For the complete FCB model specification and estimated results, see Morris and Regehr (2014).
- 9 It is not possible to determine if the changes are statistically significant for technical reasons related to the interactive effects in the model.
- 10 The predictions are out-of-sample predictions of community bank net interest income from the second half of 2007 to the second half of 2014. The out-of-sample predictions use the actual values of the variables but the predicted values of lagged net interest income.
- 11 The root-mean-square error is defined as the square root of the sum of the squared prediction errors.
